Why Are There So Many Meetings at Work?
Meetings take 12% of work hours and 14% of firm wage bills, and they exist because planning, problem solving, information sharing and project coordination are hard to do alone. That is the finding of a September 2026 NBER working paper on more than 9,000 workers in Norway. Workers who meet more also saw faster wage growth: 0.47 percentile points more a year per standard deviation of weekly meeting hours. It is a correlation from one country, not proof that more meetings pay (Deming et al., 2026).
What the paper found
Meetings are common, expensive and mostly about coordination. The average Norwegian worker spends 4.7 hours a week in meetings, 12% of a 37.5-hour week, and firms spend about 14% of their wage bill on that time, roughly USD 9,000 per employee per year (Deming et al., 2026, p. 2). The authors call this a lower bound: it leaves out preparation, travel, follow-up work and the cost of switching attention.
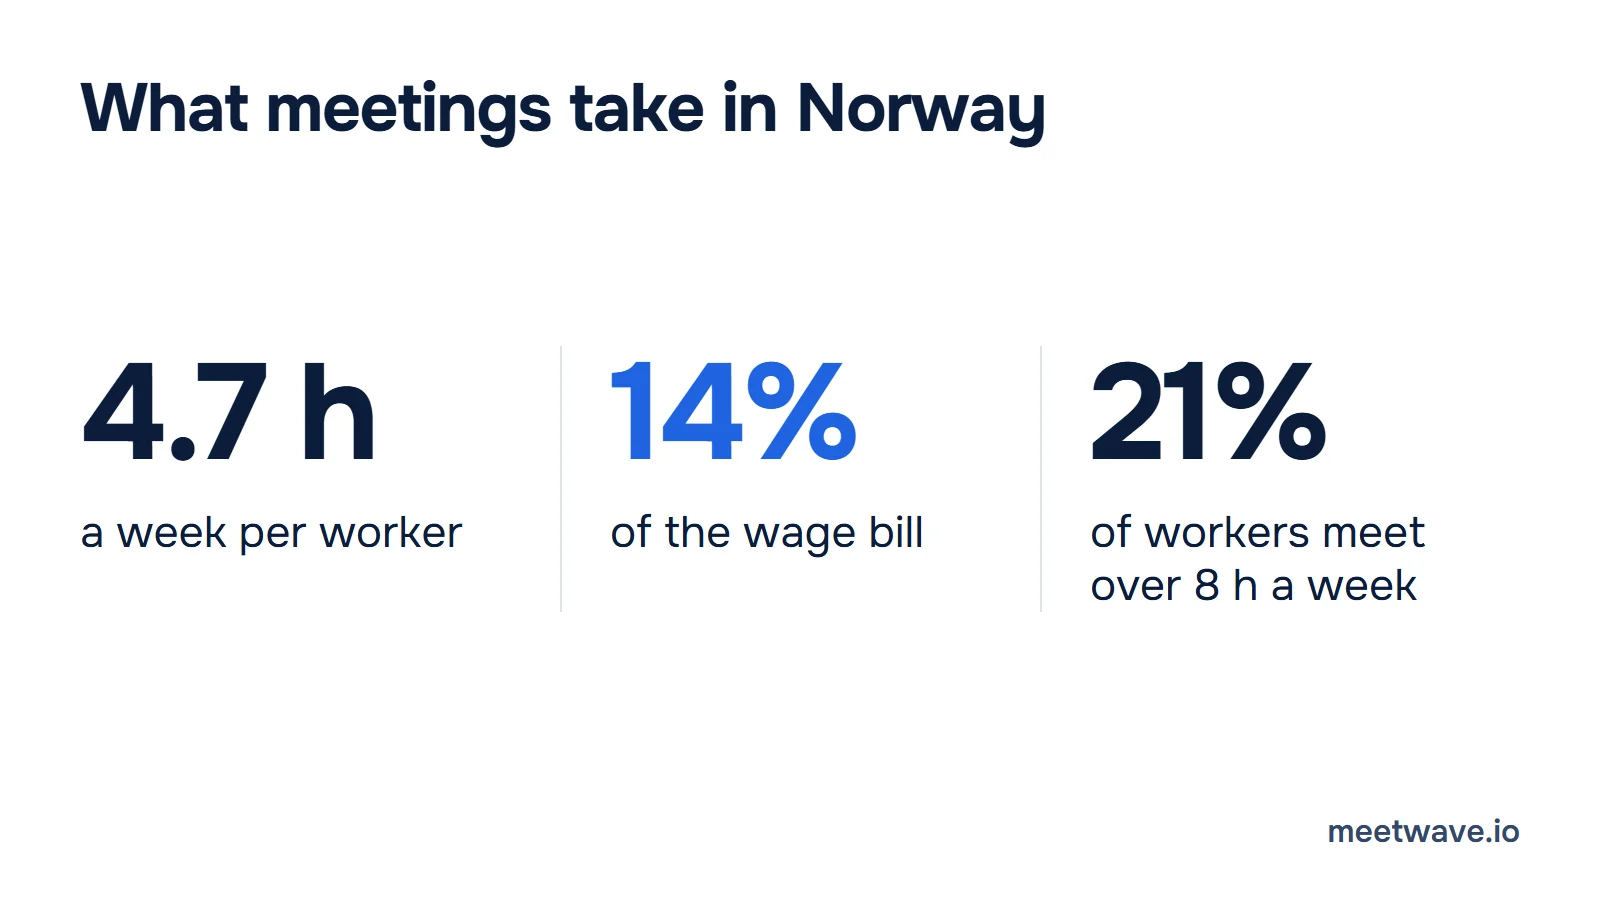
 Figure 1. Meeting time and its cost in Norway: 4.7 hours a week, 14% of the wage bill, 21% of workers above 8 hours. Source: Deming, Løken, Willén and Xu, NBER Working Paper 35706, 2026, pp. 2 and 10.
The average hides a wide spread. About 40% of workers meet less than once a week, while 21% spend more than 8 hours a week in meetings (Deming et al., 2026, p. 10). Among the 60% who attend meetings regularly, the average is about 80 minutes per workday. Meeting time is highest in finance and insurance, information and communication, professional services and public administration, around 20% of the wage bill, and lowest in transport, agriculture and retail, under 10%.
What the meetings are for is stable across jobs. Updates on projects and tasks, collaboration and problem solving, and planning and strategy are each reported by roughly half of respondents who attended a meeting; administration, networking and informal talk are reported far less (Deming et al., 2026, p. 17). Managers and professionals meet more than other workers, and differences by age and gender are comparatively small (Deming et al., 2026, p. 4).
The next question is whose fault the calendar is. The paper decomposes the variation in weekly meeting hours and finds that the occupation explains 28.2% of it, the employer 19.3% and personal traits such as age, gender and education 10.2% (Deming et al., 2026, Table 1, p. 20).
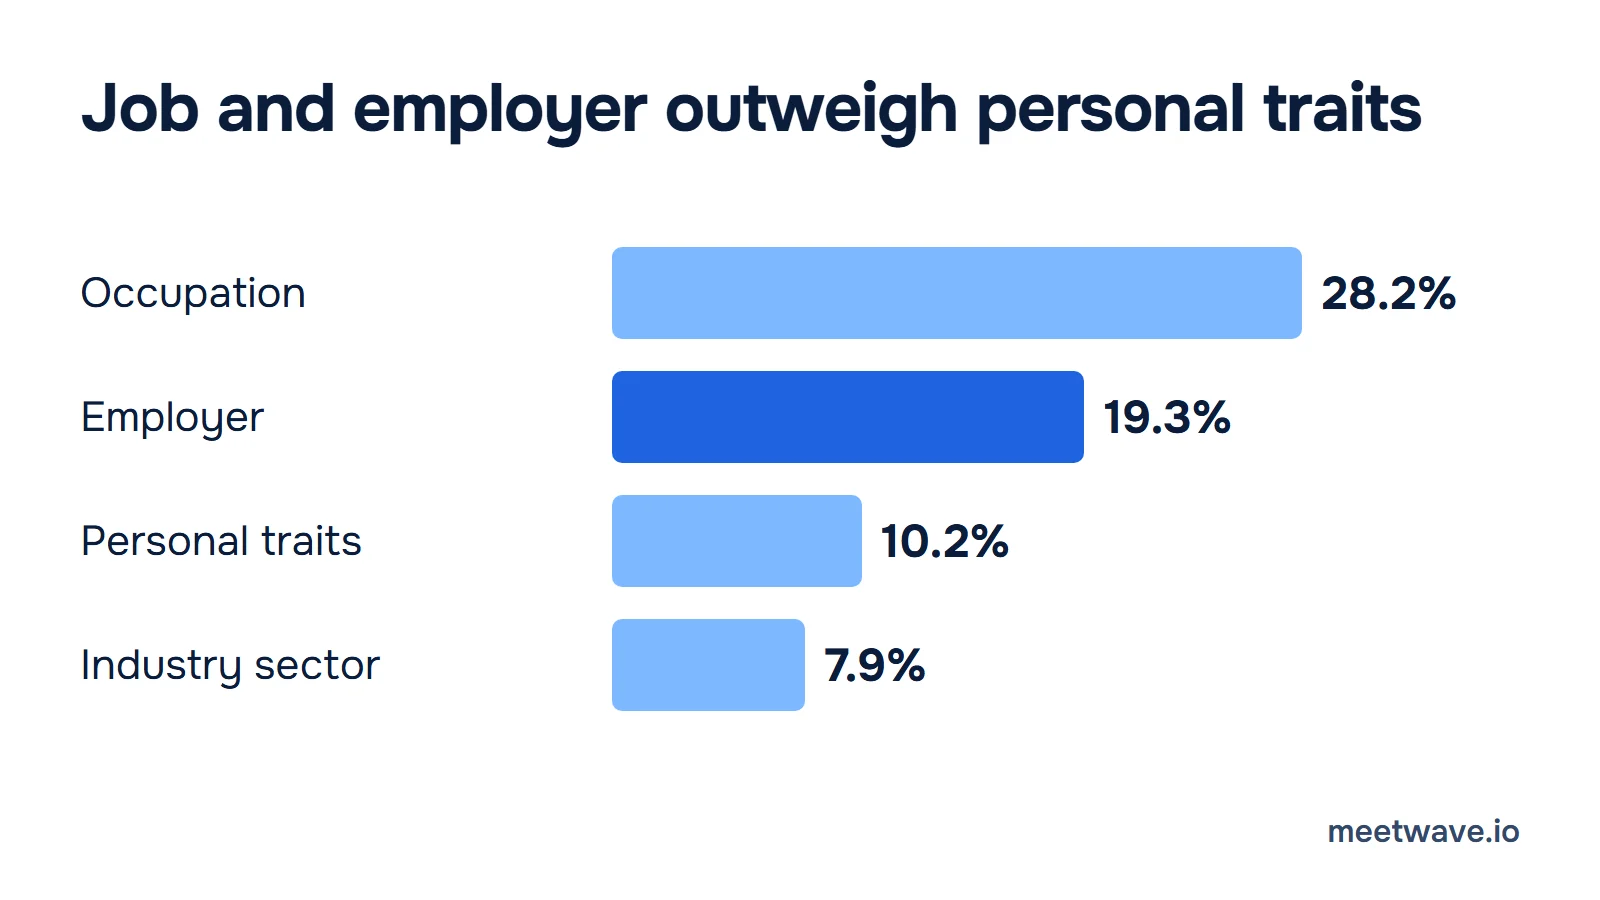
 Figure 2. Share of variation in weekly meeting hours explained by each factor alone. Source: Deming, Løken, Willén and Xu, NBER Working Paper 35706, 2026, Table 1, p. 20.
Read it as a plain answer: your meeting load depends more on what you do and where you work than on who you are. Two people with the same job at different firms can have different calendars because the firm sets how much it leans on meetings (Deming et al., 2026, p. 20).
Why the paper does not say "more meetings are good"
The headline relationship is a correlation, and the authors say so. Higher-paying and higher-revenue firms hold more meetings, even though an hour of their employees' time costs more (Deming et al., 2026, p. 21). Within firms, workers with more meeting time had faster wage-rank growth between 2022 and 2023: 0.467 percentile points a year per standard deviation of weekly meeting hours, against 0.113 for an index of team climate and slightly negative values for shared responsibility and team support (Deming et al., 2026, Table 2, p. 25).
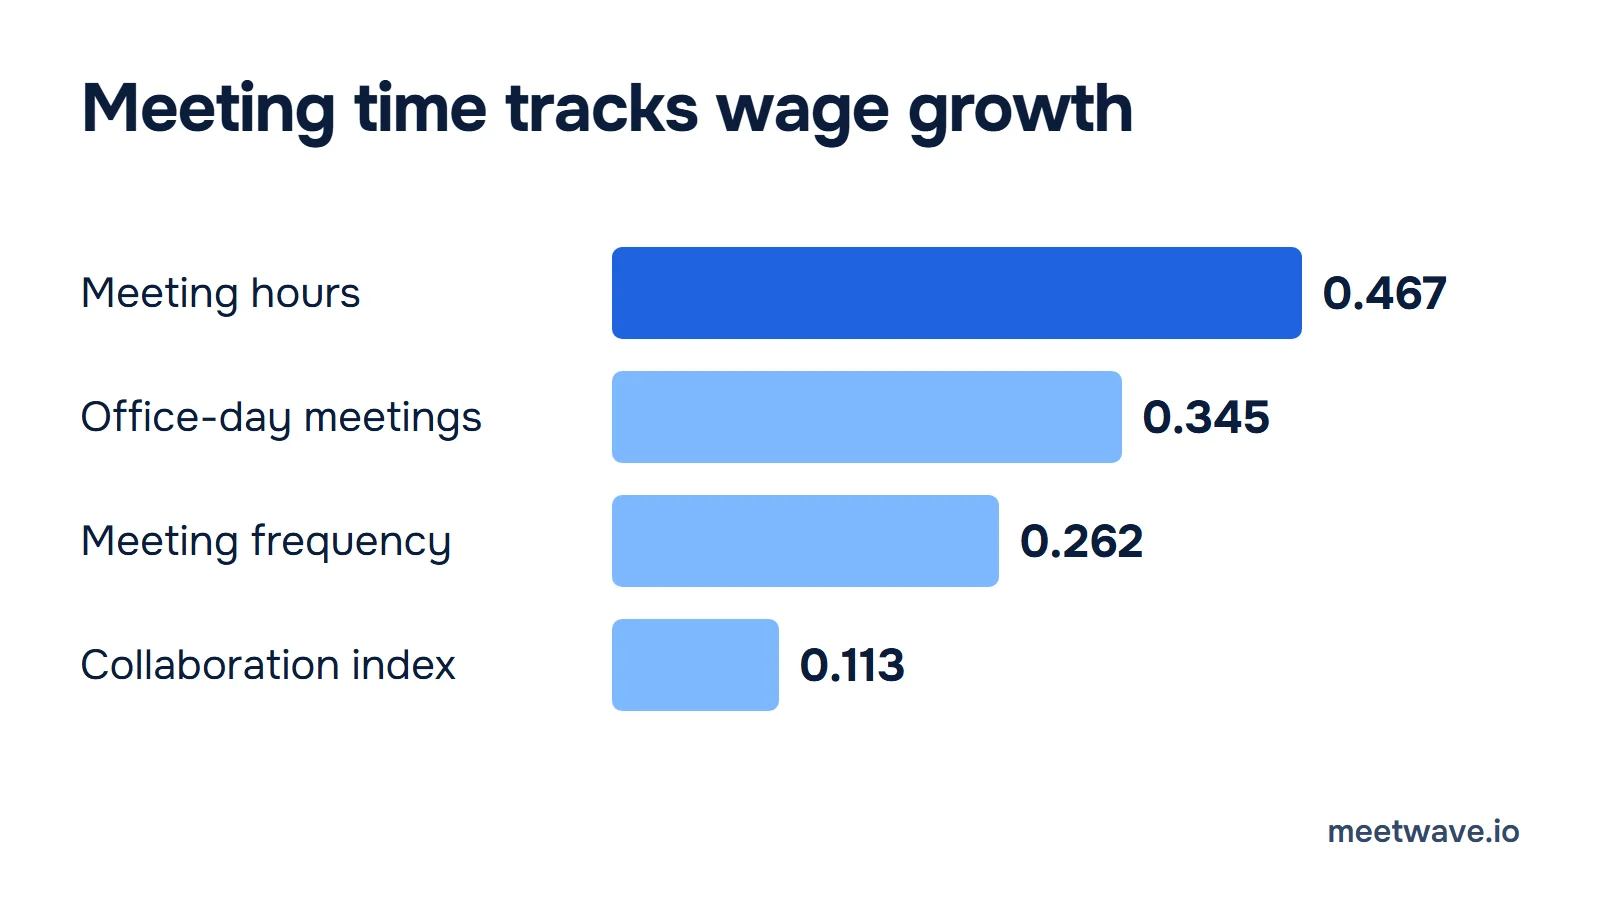
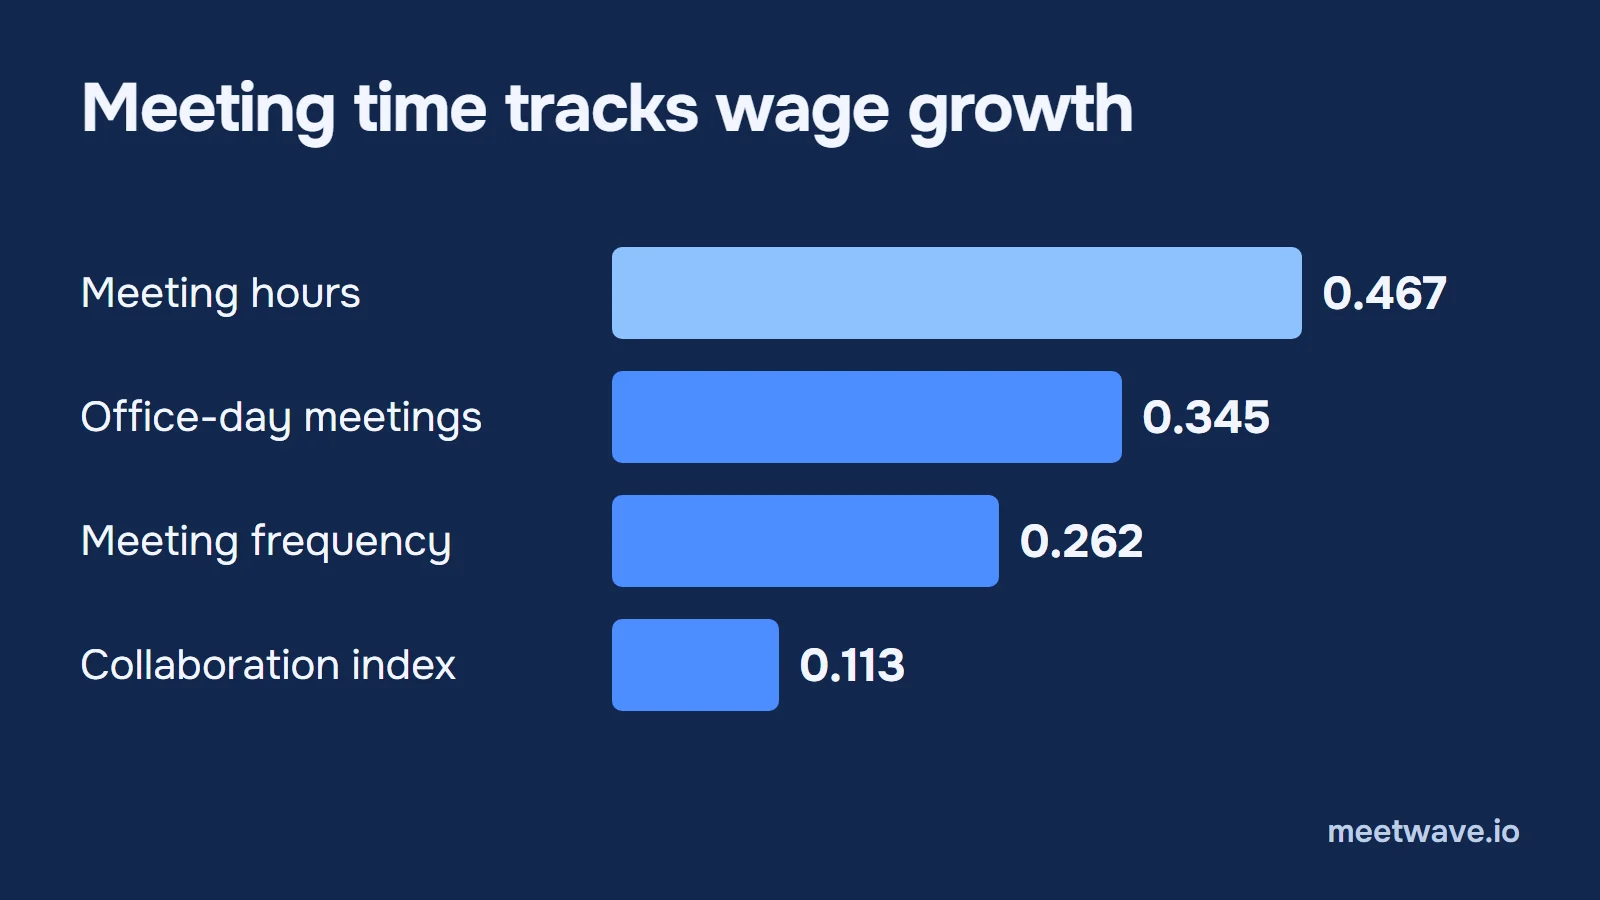 Figure 3. Wage-rank growth in percentile points per standard deviation of each workplace measure, Norway, 2022 to 2023. Correlations, not causal effects; the collaboration index is not statistically significant. Source: Deming, Løken, Willén and Xu, NBER Working Paper 35706, 2026, Table 2, p. 25.
Five limits keep this from becoming advice, and the authors and NBER name the first two themselves.
- No causal claim. The authors write that their results "do not establish a causal return to meetings": ambitious or able workers may sort into meeting-heavy jobs (Deming et al., 2026, p. 5).
- Working paper. NBER working papers have not been peer-reviewed (Deming et al., 2026, cover page). This article uses the September 2026 version (No. 35706) and will need a check when the paper is revised.
- One country, one survey. The data are Norwegian workers surveyed in May to July 2025, and respondents earn more and work in larger firms than the average worker (Deming et al., 2026, p. 7).
- Timing. Meetings were measured in 2025 and wage growth in 2022 to 2023, so the link assumes that a worker's meeting load is stable over time (Deming et al., 2026, p. 9).
- Small effects, no tipping point. 0.47 percentile points of rank a year is a modest move on a 100-point scale (our reading), and the paper leaves open when meetings help and when they reflect unnecessary coordination costs (Deming et al., 2026, p. 30).
Disliking meetings is not contradicted either. The paper's own summary is that meetings are "the broccoli of work", widely disliked but probably good for us anyway (NBER abstract). Workers in meeting-intensive firms do not rate their meetings as more productive than other workers do (Deming et al., 2026, p. 19).
How many meetings is too many
The paper gives no limit, and neither does this article. What it gives are the benchmarks Norwegian firms actually sit at: most firms spend 5% to 15% of their wage bill on meetings, and the average worker spends 4.7 hours a week (Deming et al., 2026, p. 10). Above 8 hours a week, a worker is in the top fifth: 21% of the sample (Deming et al., 2026, p. 10).
A limit that fits your team comes from your own numbers. The paper shows that occupation and employer drive meeting load, so a fixed rule would ignore both (Deming et al., 2026, p. 20). Compare your calendar with the 4.7-hour average and with your own role, and ask what the extra hours buy.
Which meetings to keep and which to cut
Keep the meetings where people learn from each other. Workers in meeting-intensive environments report more on-the-job learning: one standard deviation of weekly meeting hours goes with 0.077 of a standard deviation more agreement that "I am better at my job than a year ago", and 0.094 for "I learned new skills" (Deming et al., 2026, Table 4, p. 28). These are self-reports on a 1 to 10 scale.
Keep the time with more senior colleagues. Time spent working with higher-seniority coworkers is associated with faster wage-rank growth, 0.268 alone and 0.262 with the other seniority groups in the model, while the same and lower seniority groups show nothing distinguishable from zero (Deming et al., 2026, Table 3, p. 26). The paper warns this result is sensitive to career-stage controls, and the measure is time working with senior people, not meetings alone.
Cutting is our reading, not the paper's. Concentrated individual work has strong predictive power for wage growth but is not positively correlated with it (Deming et al., 2026, p. 28), and project updates are among the three most common meeting purposes (Deming et al., 2026, p. 17). The paper does not test which meetings are wasteful. Our suggestion: if a meeting only moves information one way, send it in writing, and keep the live time for problem solving and learning.
The checklist below turns that into questions for each recurring meeting. It is our own tool, built on the paper's categories (planning, problem solving, information sharing, project coordination, learning with senior colleagues) rather than on a tested rule (Deming et al., 2026, p. 17).
Meeting audit: one recurring meeting

Meeting: [name]   Weekly hours per person: [h]   People: [n]

1. Purpose. Which of these is it? [planning / problem solving / information sharing / project coordination / learning from senior colleagues]
2. Decision or output. What exists after it that did not before? [one line]
3. One-way or two-way. Does more than one person speak in a typical session? [yes / no]
4. Learning. Does a junior person hear senior colleagues reason here? [yes / no]
5. Replace test. Could the same content go in a written note read in 5 minutes? [yes / no]
6. Cost. People x hourly cost x hours x 52 = [amount] a year.
7. Verdict: keep / shorten / make it written / drop. Review again on [date].
What it costs in your company
Put the paper's average hours at your own price per hour. The calculator method is people x hourly cost x hours. Take a team of 10 US management and professional employees, whose employer cost was $78.88 per hour in June 2026 (BLS), and give each the Norwegian average of 4.7 meeting hours a week (Deming et al., 2026, p. 2). That is 244.4 hours per person per year and $192,787 for the team (how we calculated).
That figure is a scenario, not a US finding: the 4.7 hours is a Norwegian average, and the BLS rate is for one occupation group. Use your own headcount, rate and hours. MeetWave's meeting cost calculator does the multiplication, and How Much Does a Meeting Cost in 2026? explains where each rate comes from (BLS).
Key numbers
- Norwegian workers spent 4.7 hours a week in meetings, 12% of a 37.5-hour week, in a 2025 survey of 9,099 workers (Deming et al., NBER Working Paper 35706, 2026, p. 2).
- Meetings took about 14% of firm wage bills in Norway, roughly USD 9,000 per employee per year, in 2023 wage data (Deming et al., 2026, p. 10).
- 21% of Norwegian workers spent more than 8 hours a week in meetings, and about 40% met less than once a week (Deming et al., 2026, p. 10).
- One standard deviation more weekly meeting hours went with 0.47 percentile points faster annual wage-rank growth in Norway, 2022 to 2023, a correlation (Deming et al., 2026, p. 5).
- Occupation explained 28.2% of the variation in weekly meeting hours and the employer 19.3% (Deming et al., 2026, Table 1, p. 20).
- US employers paid $78.88 per hour worked for a management, professional or related employee in private industry in June 2026 (BLS, Employer Costs for Employee Compensation).
How we calculated
Method. Cost of meeting time per year = people x hourly employer cost x weekly meeting hours x 52 weeks. Inputs: 10 people; $78.88 per hour, the June 2026 employer cost for management, professional and related occupations in US private industry (BLS); 4.7 hours per person per week, the Norwegian average (Deming et al., 2026, p. 2).
Worked through: 4.7 x 52 = 244.4 hours per person per year; 244.4 x $78.88 = $19,279 per person; x 10 people = $192,787, rounded to whole dollars (BLS). Computed 2026-10-30. The figure counts paid time only, in line with the paper's own lower bound (Deming et al., 2026, p. 2).
All other numbers on this page are the paper's. Page numbers are the printed numbers in the working paper PDF, which sits one page lower than the PDF's own page counter. Figures 1 to 3 are redrawn from the paper's text and Tables 1 and 2 with the same numbers and rounding (Deming et al., 2026).
FAQ
Why are there so many meetings at work?
In the largest economic study of the question, meetings are mostly coordination: planning, problem solving, information sharing and project coordination (Deming et al., 2026, abstract). Meeting load also depends on the employer: firms explain 19.3% of the variation in weekly meeting hours (Table 1, p. 20).
How many meetings is too many?
The paper sets no limit. Its benchmarks are 4.7 hours a week on average, and 21% of workers above 8 hours a week (Deming et al., 2026, p. 10).
Are meetings a waste of time?
Workers dislike them, but the paper finds that firms that pay more and earn more hold more of them, and that workers who meet more report more on-the-job learning (Deming et al., 2026, abstract). It does not show that any given meeting is worth its cost, and it does not test causation.
Do more meetings lead to higher pay?
Meeting hours and wage-rank growth are positively related, 0.467 percentile points a year per standard deviation, but the authors state that the results do not establish a causal return (Deming et al., 2026, Table 2, p. 25).
What does too many meetings cost a company?
In Norway, about 14% of the wage bill goes to meeting time (Deming et al., 2026, p. 10). For your own team, multiply people, hourly cost and hours (how we calculated).
Sources
- Deming, D. J., Løken, K. V., Willén, A. and Xu, Y. — Meetings, NBER Working Paper 35706: abstract page (2026). DOI 10.3386/w35706. Accessed 2026-10-30.
- Deming, D. J., Løken, K. V., Willén, A. and Xu, Y. — Meetings, full working paper PDF, September 2026 version (2026). Tables and page numbers cited above come from this file. Accessed 2026-10-30.
- U.S. Bureau of Labor Statistics — Employer Costs for Employee Compensation, June 2026, table 4 (2026). Accessed 2026-10-30.
Still comparing tools?
See how MeetWave stacks up against the tools most teams evaluate alongside it.
- MeetWave vs tl;dvSee how MeetWave compares to tl;dv for meeting intelligence
- MeetWave vs FathomFree AI meeting assistant and note taker focused on sales teams
- MeetWave vs FellowSee how MeetWave compares to Fellow for meeting notes and AI summaries
More on this: Free tools